
I’ve seen a lot of conversation about the Sigenergy system and home solar in general, and I thought I would create a useful webpage to help others. I’m hosting this on the back of our travel website to save the cost of setting up a new one. After we finished 11 years of travel, we bought a house in County Wexford, Ireland, and had a Sigenergy system installed. If you look at the ‘Truck and Kit’ pages on the main website, you’ll see that I can be a bit of a geek, and I’m hoping this will help me explain some of how the system works and the choices we made. I have an electronics background, having started my career fixing aircraft radar systems, then earning an MSc in Avionics and conducting flight trials at Boscombe Down in the UK. However, I am not a qualified domestic electrician and will not give any advice on wiring the system – this is for your installer and qualified electrician to handle.
As I’m now based in Ireland, many of the decisions for our system were based on Irish regulations and what is called the NC6 for domestic ‘Micro Generation’. If you’re in another country, different rules will probably apply, so you may make different choices. The Sigenergy software is advancing very quickly, so some of the screenshots I share and even some functionality will likely change over time. I’m writing this in January 2026. I’ll try to keep pace with the changes, but you may find some differences. However, the general principles should remain valid. Our system was installed by EnergyServ, based in New Ross. I’ve been very happy with their work and would recommend them. If you choose to use them, feel free to let them know if you found this page useful. The page is quite long, so I’ve broken it down into the sections listed below. Clicking on the section titles will take you directly to that section.
- Solar Panels
- Tigo Optimisers, Cloud Connect Advanced (CCA) and Tigo Access Point (TAP) and Micro Inverters
- Hybrid Inverter
- Batteries
- Gateway
- Generators
- AC EV Charger – Tesla Wall Connector
- DC EV Charger – Sigenergy
- Basic Electrical Understanding
- Creating a Time-of-Use Profile
1. Solar Panels
Types of panels
Solar panels (also known as photovoltaic or PV panels) generate electricity from solar radiation. The two most common types are monocrystalline and polycrystalline. Both convert sunlight into electricity using silicon cells, but they differ in how the silicon is structured and processed. Monocrystalline panels are made from a single continuous silicon crystal, while polycrystalline panels are made by melting and combining multiple silicon fragments. These differences affect efficiency, cost, appearance, and performance.
Which to Choose?
Choose monocrystalline if you have limited space, prioritize long-term savings and higher output, or want a sleeker look (e.g., for residential rooftops). This is what we have.
Choose polycrystalline for budget-conscious projects with ample installation space, like large commercial arrays, where upfront cost savings matter more.
Bifacial panels
Some panels are bifacial, meaning they can produce electricity from light on both sides. For a roof installation, this added feature doesn’t make much difference compared to a normal single-sided panel. However, on a ground-mounted system where reflected light can reach the rear, it can be beneficial. Higher-quality panels tend to be bifacial, as that’s what large solar farms with ground-mounted systems prefer. Our solar panels are bifacial on our ground mounted ones and roof-mounted ones.
What happens if you are not taking power from the panel
I’ve seen the question “What happens if you’re not taking power from the panel?” asked on several forums. There’s concern that if power can’t be drawn from the solar panel, it may overheat or suffer some other problem. This is not the case. If you don’t pull power from the solar panel, there is no current flow and therefore no heating or ill effect. It’s a bit like having a battery sitting on the table: it has energy ready to be used, but nothing happens until you draw that energy from it.
Solar panels in strings
When solar panels are connected in series, it’s called a string. These strings connect to a solar controller (or MPPT in the inverter) that converts the power from the panels into a form suitable for the system – generally DC at a certain voltage and current.
For example, you may have ten solar panels in a string. If each panel is rated at 450 Wp with a maximum power voltage of 33 V, on a sunny day in ideal conditions, the string could produce 4.5 kWp (10 × 450 Wp) at 330 V (10 × 33 V). However, a disadvantage of strings is that the entire string can only pass the power of the lowest-performing panel. If one of the ten panels has shade and its output drops from 450 Wp to 50 Wp, the total string output would be only 500 Wp (10 × 50 Wp), not the 4.1 kWp (9 × 450 Wp + 50 Wp) you might expect! The solution is a device called an optimizer, attached to the back of a solar panel. It allows the full power of the other panels to pass through while adding the power of the affected panel without limitation. With an optimizer on the shaded panel in the example above, the string output would be 4.1 kWp (9 × 450 Wp + 50 Wp). I explain more about optimizers in section 2.
One safety requirement in Ireland is a ‘firefighter’ switch for the solar strings. This is a 230 V-powered switch wired into the solar panel string. If the firefighter switch loses its 230 V supply, it disconnects the solar string from the charge controller. This is a safety feature to make the solar system safer. However, even with the firefighter switch open, there could still be 600 V DC in the solar panel cabling on the roof! A safer option is described in section 2: Tigo optimizers, Cloud Connect Advanced (CCA), and Tigo Access Point (TAP).
Solar Clipping
It is standard industry practice to install more solar (DC) capacity than the inverter’s AC output rating – this is known as DC oversizing or a high DC/AC ratio (often 1.2 – 1.5, and up to 2.0 in some Sigenergy models). The main goal is to maximize overall annual energy yield by ensuring the inverter operates closer to its full capacity for longer periods, especially during suboptimal conditions like cloudy weather, early morning, late afternoon, or partial shading. Panels rarely hit their full rated output except under ideal lab-like conditions (STC: 1000 W/m² irradiance, 25°C), so oversizing compensates for real-world losses and boosts production in “shoulder” hours.
For the Sigenergy 5.0 SP inverter with 2 MPPT trackers (some higher-power models have up to 4) allows up to roughly 10 kW (or more) of PV on a 5.5 kW AC-rated unit.
In a hybrid setup like SigenStor, excess DC power beyond the inverter’s AC conversion limit (e.g., 5.5 kW AC output) is intelligently directed to charge the connected batteries – this avoids immediate waste and is a key advantage over pure grid-tie systems without storage.
Once the batteries reach full charge (and if home loads + grid export limits are met), the system curtails PV production by shifting the operating point away from the maximum power point. This reduces output to match what’s usable (for AC loads/export), resulting in clipping (also called “inverter clipping” or “power limiting”).
Clipping is not inherently bad – it’s a controlled behaviour in well-designed systems. A small amount of clipping (often just a few percent of annual yield) is normal and often economically beneficial, as the extra panels provide more energy overall than a perfectly matched (1:1) DC/AC system would.

The clipping effect can be reduced by discharge the battery in the morning, before the solar output increases to a point where the batteries can no longer be discharged, as the inverter is already running at maximum power. Then there is more battery capacity to take the excess solar generation later in the day. This allows you to get the most from your solar generation on a sunny day, generally in summer when production is highest.
This is also where the Sigenergy DC EV charger has a big advantage. It is connected to the DC side of the SigenStor and so can take power from the solar or batteries at the same time as the inverter is at maximum output, significantly reducing the potential of clipping.
2. Tigo Optimisers, Cloud Connect Advanced (CCA) and Tigo Access Point (TAP) and Micro Inverters
As discussed in section 1. Solar panels in strings, optimizers help recover energy lost to shading. To recap: If one panel in a string of ten drops from 450 Wp to 50 Wp due to shade, the whole string would otherwise be limited to 500 Wp (10 × 50 Wp). With an optimizer on the affected panel, the string can output ~4.1 kWp (9 × 450 Wp + 50 Wp).
Optimizers are also valuable when panels on the same string face different directions (e.g., some east, some west on a roof). In such cases, all panels should ideally have optimizers. Note that many systems support multiple strings, so you could dedicate one string to east-facing panels and another to west-facing ones, avoiding the need for optimizers.
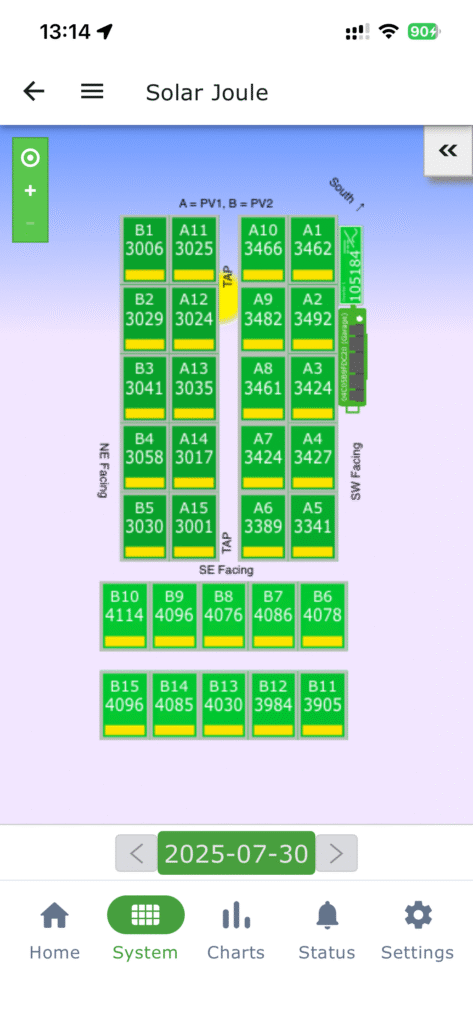
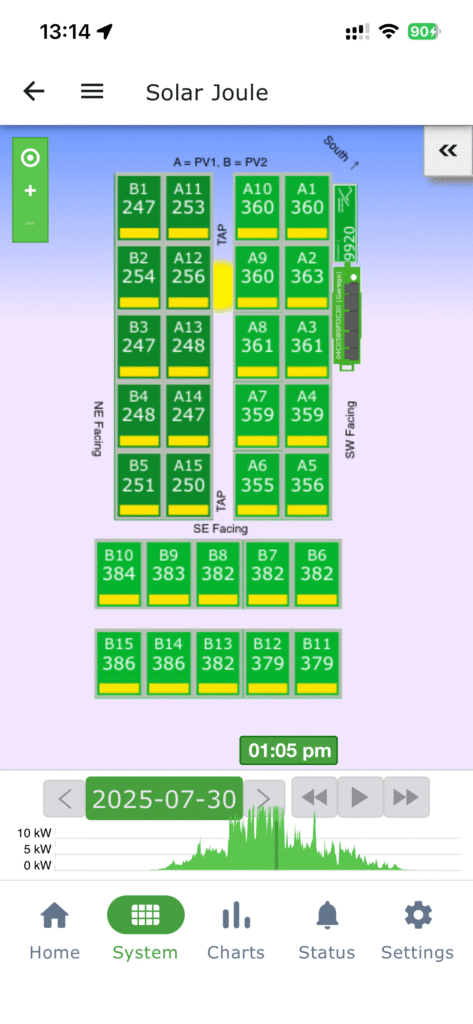
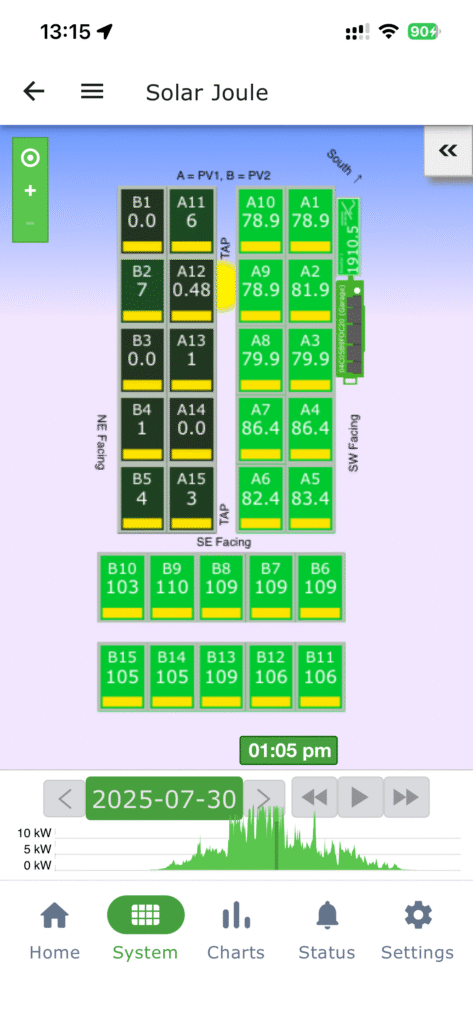
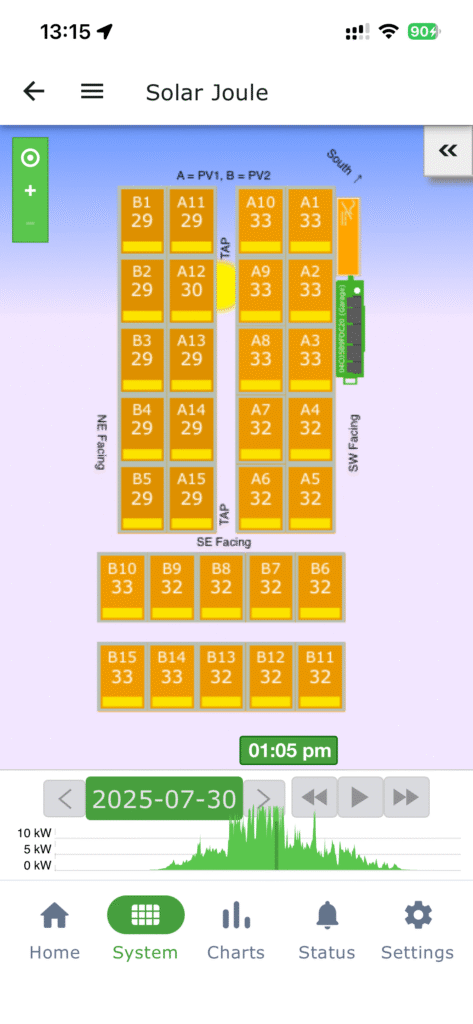
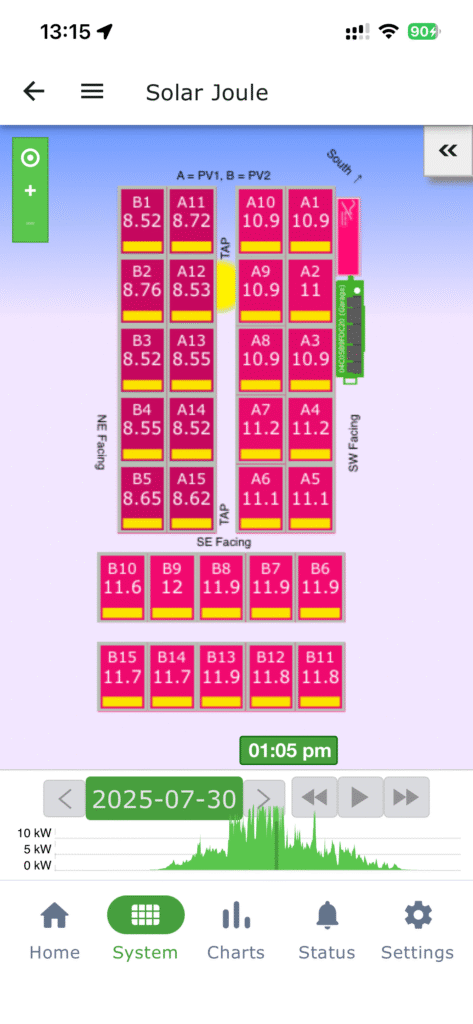
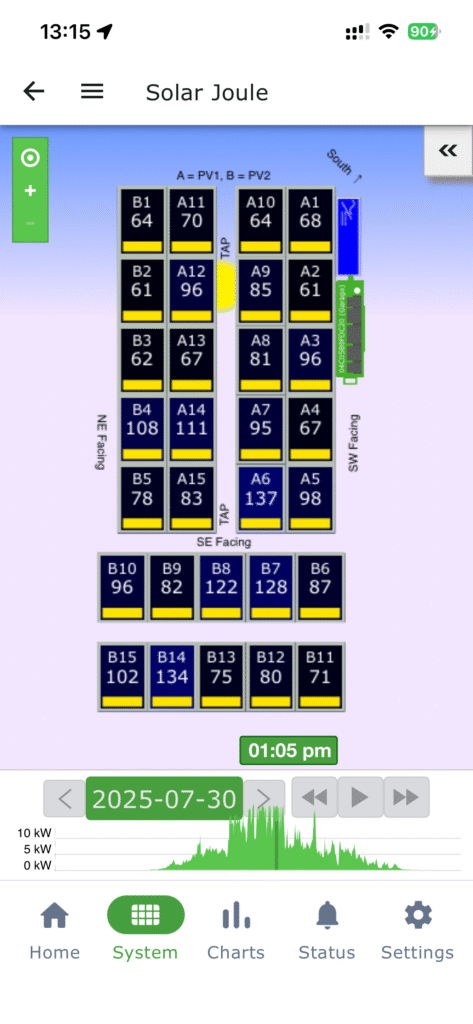
With Tigo optimizers (I have no experience with other brands), you can collect detailed per-panel data. This is useful for monitoring performance and troubleshooting faulty wiring or panels. Data collection requires a Tigo Cloud Connect Advanced (CCA) and Tigo Access Point (TAP). The TAP communicates with the optimizers, and data passes to the CCA (connected to the internet). Using the Tigo app “Tigo Energy Intelligence” (with a Premium account), you can view per-panel metrics like energy generated, power, voltage, current, signal strength, and reclaimed power.
Below are some screen-shots showing some of the available information from the Tigo App.
If the 230 V supply to the CCA is lost, the optimizers lose communication and shut down as a safety feature. This achieves similar rapid shutdown to a firefighter switch but safer: optimizers reduce string voltage to ~5 V DC per module (safe for testing cabling), unlike a firefighter switch that may leave high DC voltages present. This is why some countries mandate optimizers on all panels instead of (or alongside) firefighter switches. In Ireland, the firefighter switch remains required by regulations, but we added optimizers on all panels, plus CCA and TAP, for enhanced safety and monitoring.
To configure the CCA, you’ll need serial numbers and array layout for all optimizers. Tigo optimizers have removable QR stickers with serial numbers (or scan the QR code). I drew my panel layout on paper, and the installers affixed the QR stickers in their corresponding positions – this made CCA setup straightforward.
Micro Inverters
Due to the inverter rules in Ireland (under NC6 the maximum total inverter size is not to exceed the export limit) Micro Inverters are not a practical solution here as more solar capacity than inverter capacity is desirable and so I have not covered them. They are a good alternative to strings with optimisers and provide some safety benefits like optimisers, so should be considered if you live in a country where they are practical under the regulations.
3. Hybrid Inverter
An inverter converts Direct Current (DC) to Alternating Current (AC). Solar panels and batteries output DC, while the grid uses AC. A hybrid inverter handles both directions: DC to AC (for house/grid use) and AC to DC (for battery charging).
Our Sigenergy SigenStor includes a 5.0 SP hybrid inverter—the largest single-phase model commonly allowed under Irish NC6 microgeneration rules (typically ~5–6 kW export limit for domestic without additional approvals). It’s IP66-rated for outdoor use and includes built-in Maximum Power Point Tracking (MPPT) controllers. The 5.0 SP has two MPPTs (some higher-power models have more).
MPPTs interface between solar strings and the inverter’s DC bus. Strings might output ~550 V DC, while batteries operate around 30–50 V nominal. MPPTs dynamically adjust the load on each string to operate at the maximum power point (hence the name “Maximum Power Point Tracking”), converting high-voltage/low-current DC from panels to lower-voltage/higher-current DC suitable for the inverter or batteries. They continuously track changes (e.g., due to clouds or temperature) for optimal harvest. This DC power can then be inverted to AC for house use/export or stored in batteries.
Inverter Connectivity
The Sigenergy inverter has 3 options for connecting to the internet:
- Ethernet cable
- WiFi
- 4G Dongle
The system will prioritise Ethernet, then WiFi and finally the 4G dongle.
4. Batteries
General Information
Sigenergy SigenStor batteries are modular LFP (lithium iron phosphate) units – all the same physical size but different capacities (e.g., 5 – 9 kWh nominal per module). Up to six can stack (with the inverter/energy controller on top). They’re IP66-rated for outdoor use, include insulation/heaters for cold weather, and feature built-in safety like fire suppression.
SigenStor batteries have a C0.5 value which means they can be charged or discharged at half their capacity. i.e. 9 kWh battery can be charged or discharged at 4.5 kW, 18 kWh – 9 kW etc.
Usable capacity is effectively 0–100% as displayed (Sigenergy rates them conservatively; real capacity is slightly higher to allow full use without damage). We have 3 × 8.0 (8 kWh) and 2 × 10.0 (9 kWh usable) modules, totalling ~42 kWh nominal.
Sate Of Charge (SOC) Calculation
LFP batteries have a very flat voltage curve vs. state of charge (SOC), making voltage-based SOC estimation unreliable. The system uses coulomb counting (tracking energy in/out) to estimate SOC. Over time, this can drift, so periodic full charges to 100% are essential to recalibrate – when cells reach full, current drops to zero, confirming 100% SOC.
Cell Balancing
In a series string of cells, once one cell hits full, charging stops for the string. The BMS balances by bleeding excess from full cells (dissipating as heat), allowing others to continue charging. This explains why charging often lingers at 99.9% for a while before hitting 100% – current gradually tapers during balancing and can be seen in the app as the charging power reduces.
Warranty
The Sigenergy battery warranty is based on ‘Minimum Throughput Energy’. To ensure the battery maintains over 60% of its capacity after 10 years, the battery should not throughput energy above the following levels in that time:
BAT 5.0 (5.38 kWh capacity, 5.20 kWh usable) throughput limit 18.20 MWh = 4.98 kWh a day average
BAT 6.0 (6.02 kWh Capacity, 5.84 kWh usable) throughput limit 20.44 MWh = 5.60 kWh a day average
BAT 8.0 (8.06 kWh capacity, 7.80 kWh usable) throughput limit 27.30 MWh = 7.48 kWh a day average
BAT 10.0 (9.04 kWh capacity, 8.76 kWh usable) throughput limit 30.66 MWh = 8.40 kWh a day average
It should be noted that most lithium battery suppliers are finding their batteries are lasting far longer, so I suspect the above figures would result in a much lower degradation of the battery capacity over the 10 years. You can find this warranty information in the app by going to ‘Support’, ‘Documents’, then on the webpage, part way down, Warranty and viewing “SigenStor Warranty”. The above information is from the “(EUR-English)” version dated 27/05/2025, there are differences in the warranties between the global regions Sigenergy covers.
Usable Capacity
The usable energy figures from the warranty are approximately 3% lower than the SigenStor specifications battery capacity figures. Sigenergy says you can use 100% of the battery in the app, so I assume that is the usable amount and not the capacity value. The BMS manages the figures for the Sate of Charge (SOC) you see, so when the battery is discharged to 0% SOC, the 3% difference, or more, is probably left to protect the battery.
Load Shifting
Load shifting is the process of taking energy at one time, storing it, and then using at another time. This is a common practice when there is a significant difference in the cost of electricity at different times of the day. For example, using early 2026 electricity costs, my typical electricity usage is 12 kWh a day (excluding car charging) split as follows:
49% day rate, 5.88 kWh at 42.13 c/kWh = €2.48
41% night rate, 4.92 kWh at 23.16 c/kWh = €1.14
10% peak rate, 1.20 kWh at 47.13 c/kWh = €0.57
Total €4.19
However, if I charge my SigenStor batteries at night on a cheap EV rate and do not use any electricity from the grid during the day, the costs change to:
100% EV rate, 12 kWh at 5.99 c/kWh = €0.72
So, by load shifting I am saving €4.19 – €0.72 = €3.47 a day, or €1,266.55 a year!
A pair of SigenStor 10.0 batteries (17.52 kWh usable capacity) would easily cover the full load shifting required above and would cost about €6300. This means they would have paid for themselves in 4.97 years, less than halfway through their warranty life and this is not factoring in increases in electricity costs over time, which would reduce the time further.
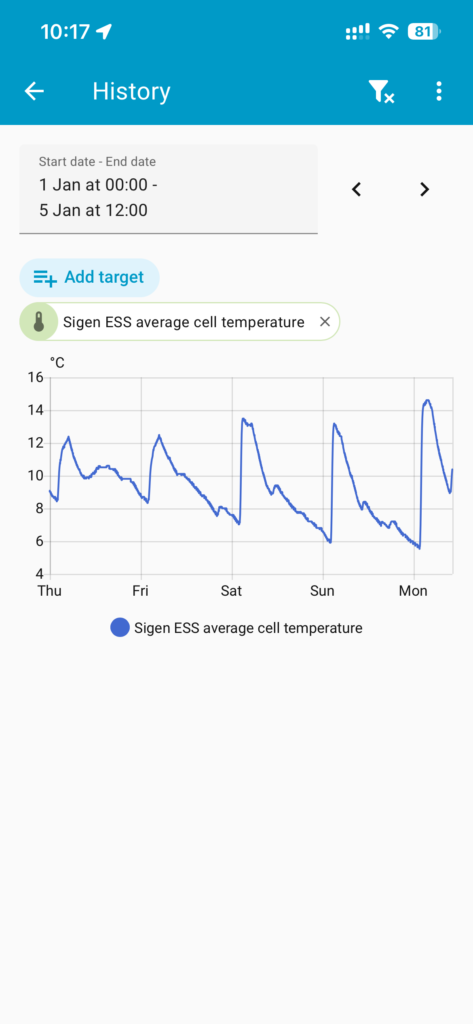
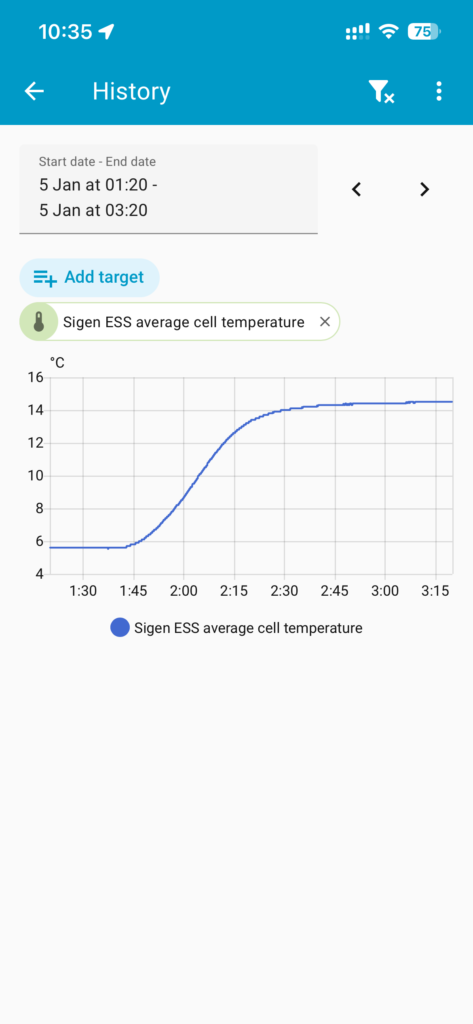
Battery Scheduled Heating
From my data the scheduled pre-heating of the batteries isn’t needed with outside mounted Sigenergy batteries until the Outside Air Temperature (OAT) drops below 0C. Once the OAT is below 0C there is an initial reduction in charge rate. Scheduling a pre-heat prior to the start of the charging period results in maximum charging at the start of the charging period. For my test I pre-heated 30 min prior to the start of charging, the amount of time required will obviously be dependent on how cold it gets. If your batteries fully charge before the end of your cheap rate electricity charging window, it may not be worth using the extra energy preheating to get a faster initial charge rate. The heaters appear to use about 50 Wh per battery for a 30 min warm at -2C, but I don’t have accurate data on this.
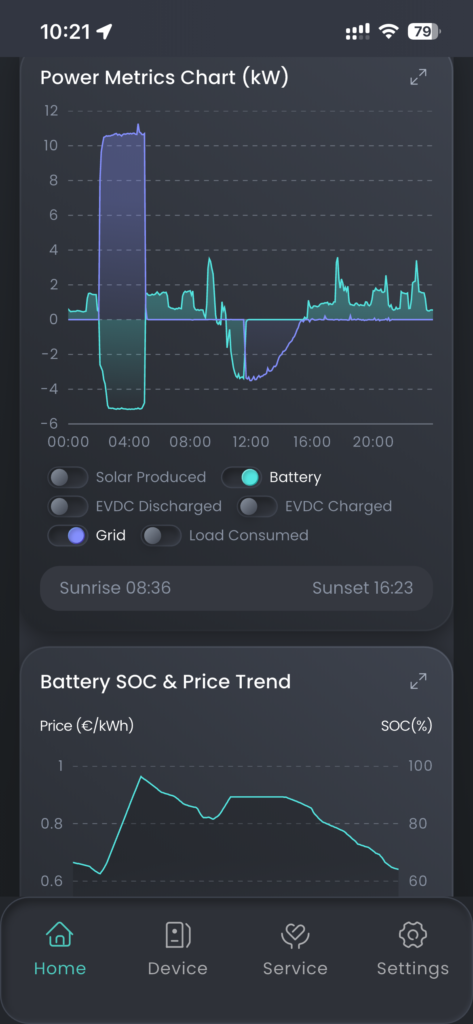
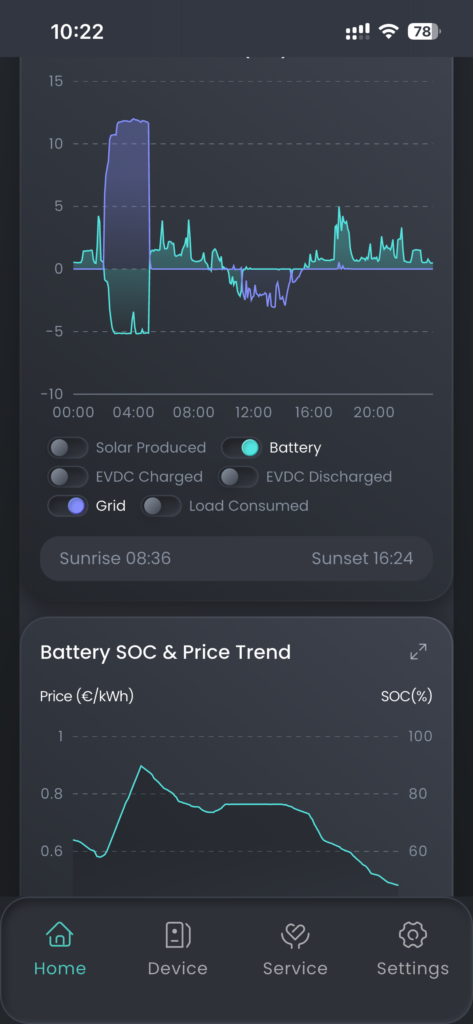
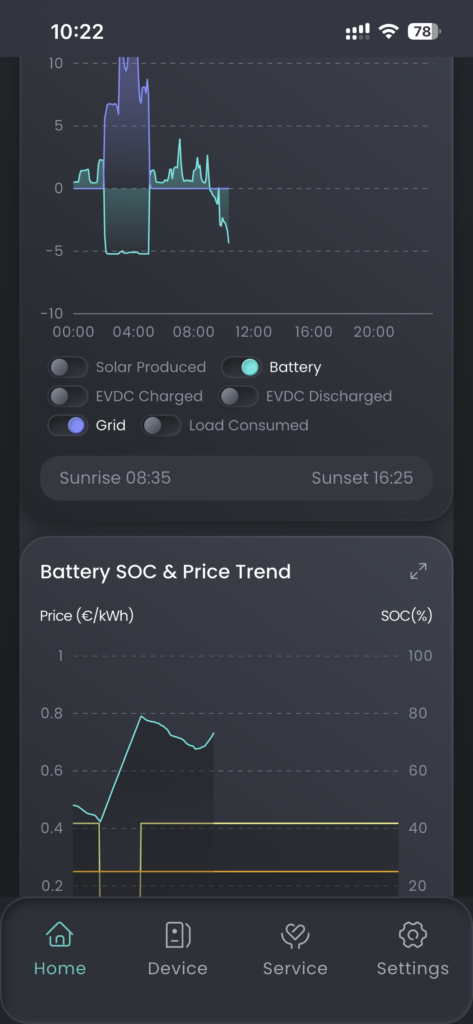
Below are some screen shots from the Sigenergy App and my Home Assistant so you can see some of the effects on charging. I will add a comment under each photo explaining what it shows.
5. Gateway
The Sigenergy Gateway (e.g., HomeMax SP or similar) enables whole-home backup during grid outages. Without it, a grid failure shuts down the inverter (anti-islanding), isolates solar via firefighter switches, and cuts access to batteries/solar even if charged.
With the Gateway, it detects outage, opens the grid contactor (isolating the house), and the inverter powers all loads from batteries/solar. Transition is seamless (0 ms claimed—no lights flicker, computers stay on). The app notifies you of off-grid mode. Solar remains available (firefighter switch stays powered), but if loads exceed inverter capacity (5.5 kW), it shuts down to protect itself. If this happens, reduce loads and restart the inverter via the red button on the inverter (behind cover panel).
On grid return, the Gateway verifies stability, synchronizes inverter phase/voltage, then closes the grid contactor.
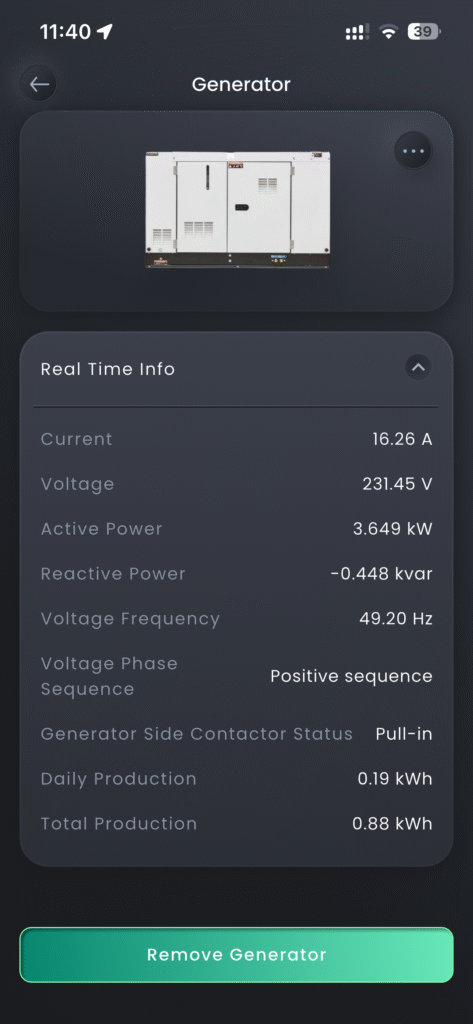
The Gateway’s Smart-Port supports specific loads or a generator (ours is generator-configured). Off-grid, it monitors the Smart-Port; if a stable generator connects, the inverter syncs, energizes the contactor, and uses generator power. Grid and generator cannot connect simultaneously.
6. Generators
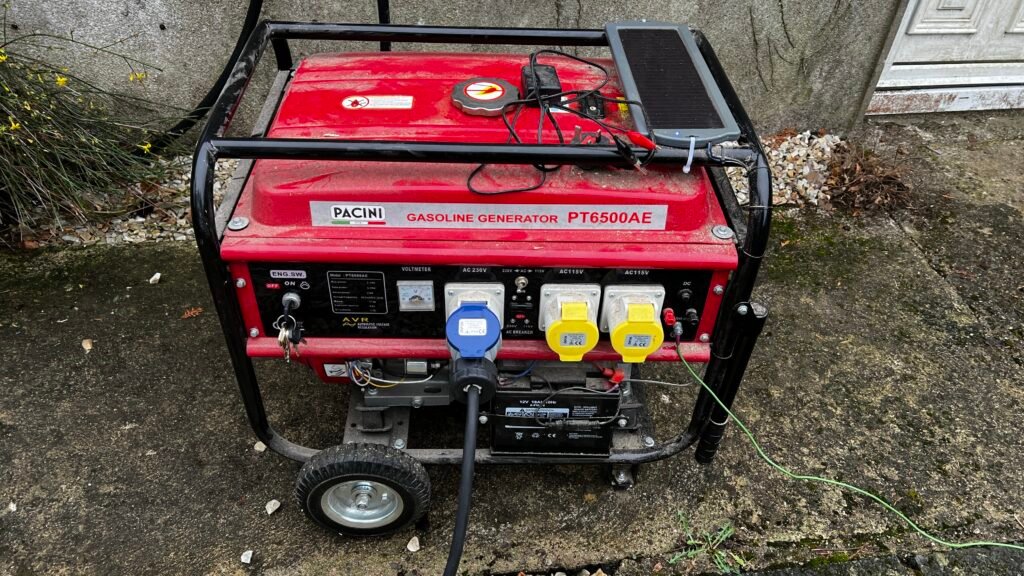
I have a 32A Commando socket on the garage wall, wired to the Gateway’s Smart-Port (configured as generator input by the installer). Here’s my manual procedure for extended outages:
- Start the generator (petrol) and idle ~2 minutes to warm up (diesel idling is less useful without load). Don’t plug in yet.
- For testing I simulate outage by turning off the Gateway’s grid breaker (not main house breaker, which may trigger inverter shutdown for compliance).
- With generator warmed/stable (choke off), turn on its output breaker before plugging in. (Open breaker induces low/faulty voltages that could trigger Gateway warnings; connecting with breaker on provides clean initial voltage.)
- Gateway checks output limits, syncs inverter, energizes Smart-Port contactor, then slowly loads the generator.
- My 5.5 kW generator (5 kW continuous) is set to 80% duty (~4 kW load—recommended for most generators to avoid overload/wear).
- On grid return: Gateway verifies stability, de-energizes Smart-Port (disconnects generator), syncs to grid, re-energizes grid contactor—no simultaneous connection.
- Cool down generator ~2 minutes, shut off, unplug.
There is no auto-start on my basic generator – manual only, but the Gateway can control auto-start generators if you have one.
My generator does not have an inverter output, but it does have voltage regulation. I do not know of any publication from Sigenergy giving any advice on generator types. I am sure if there was a type of generator they advised against it would have been clearly communicated. I suspect their software is clever enough to not connect to, or disconnect from, a generator if the system sees anything it doesn’t like the look of signal/power wise.
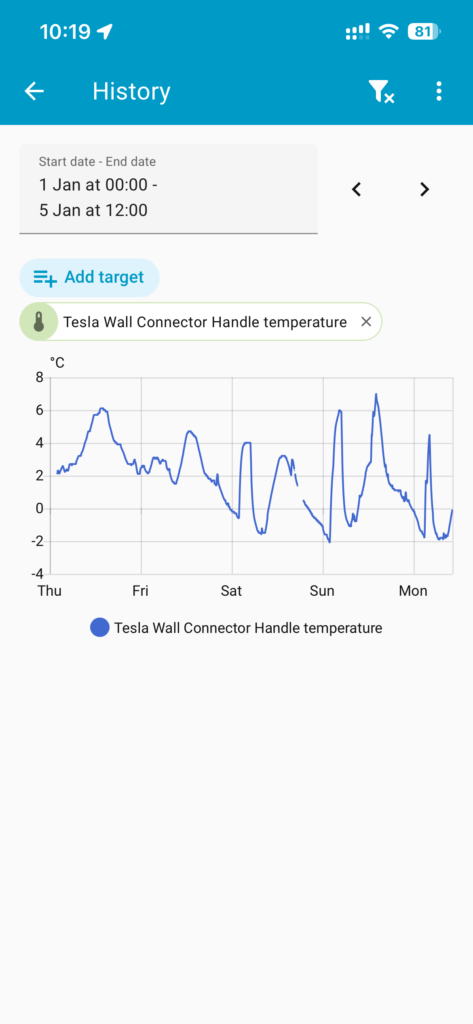
7. AC EV Charger – Tesla Wall Connector
We had a Tesla Wall Connector (AC) before SigenStor. It’s post-Gateway, so usable off-grid—but carefully, to avoid overloading the ~5 kW inverter or draining batteries. Useful on sunny days during outages: divert excess solar (that would export) to the car instead of wasting it.
However, managing it manually is tricky with a 5.5 kW inverter, you must adjust the car charge rate if using kettle/etc. to prevent overload. Now, with the DC EV charger fully integrated, this isn’t needed – DC charging pulls directly from solar/batteries without inverter load.
If you need a Type 2 EV plug holder and cable organiser I have a few 3D printable designs on Maker World you can download for free and print, see:
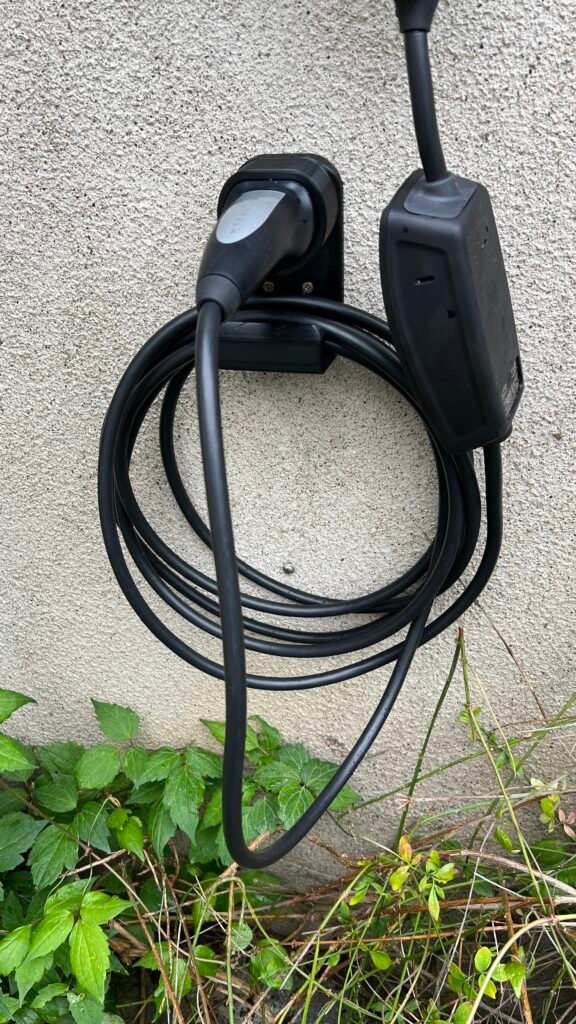
Type 2 EV Charger Plug (90 degrees to wall) and Cable Wall Bracket
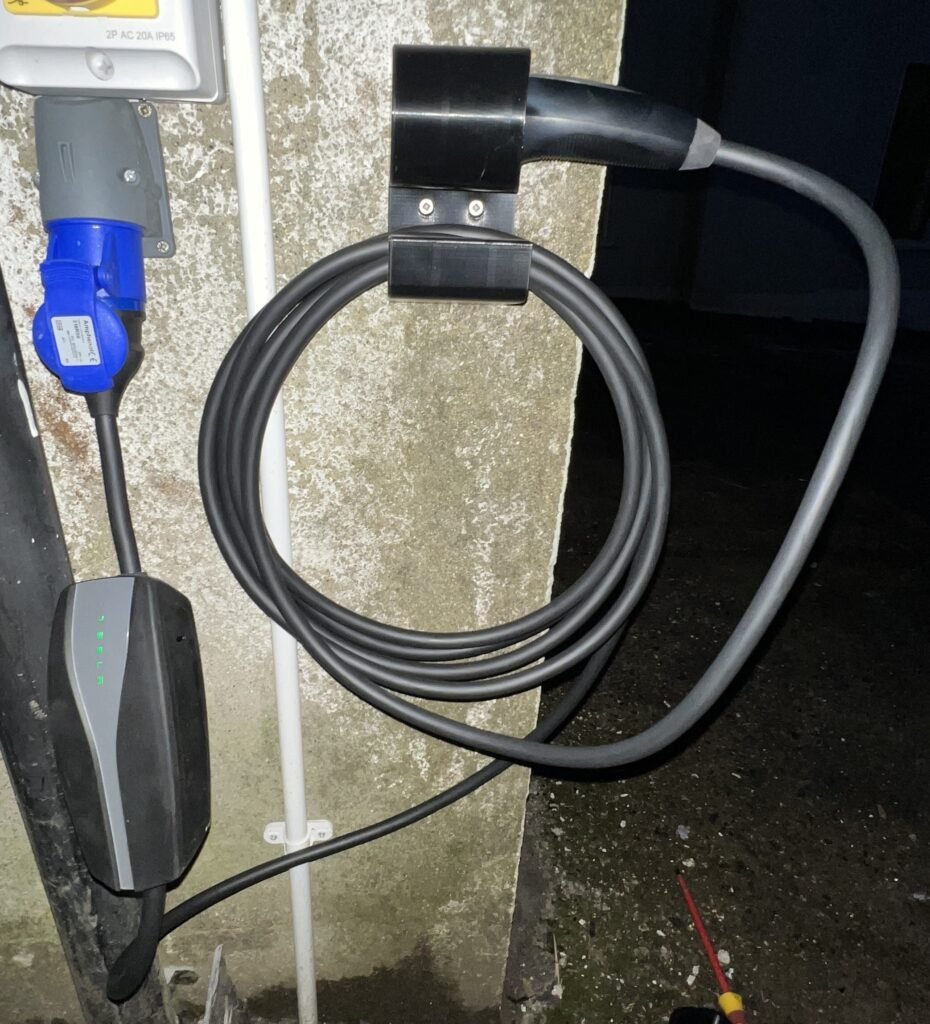
Type 2 EV Charger Plug (parallel to wall) and Cable Wall Bracket

Type 2 EV Charger Plug (parallel to wall and inclined) and Cable Wall Bracket
8. DC EV Charger – Sigenergy
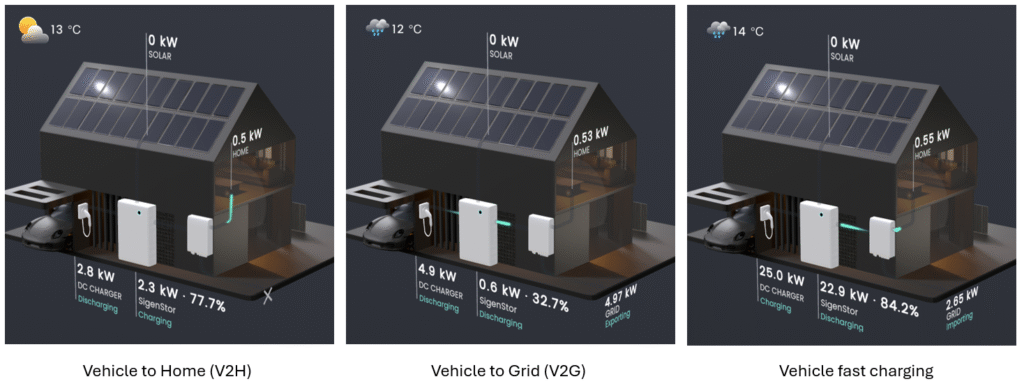
The Sigenergy DC EV charger (Sigen EVDC module) is bidirectional: charges the car and can discharge from car to house/grid (Vehicle-to-Home V2H or Vehicle-to-Grid V2G) and uses a CCS2 plug.
I initially dismissed it for our 5 kW inverter setup (limited to ~5.5 kW grid charge; no simultaneous SigenStor battery charging). AC allows parallel charging (e.g., 7.4 kW car + ~4–5 kW to batteries at night on cheap rate). But analysing 9 months’ data: average daily use ~15 kWh (house + car). Cheap-rate window (3 hours) charges batteries ~16.5 kWh – covers average even with zero solar.
With my 42kWh Sigenergy batteries, I can in theory discharge at 21kW (C=0.5) leaving a shortfall of only 4kW to achieve the maximum 25kW charging rate. I can make up this 4kW shortfall with solar or grid or a combination of both. However, the Sigstor will discharge the batteries at 23.4kW leaving only 1.6Kw to be made up from solar or grid.
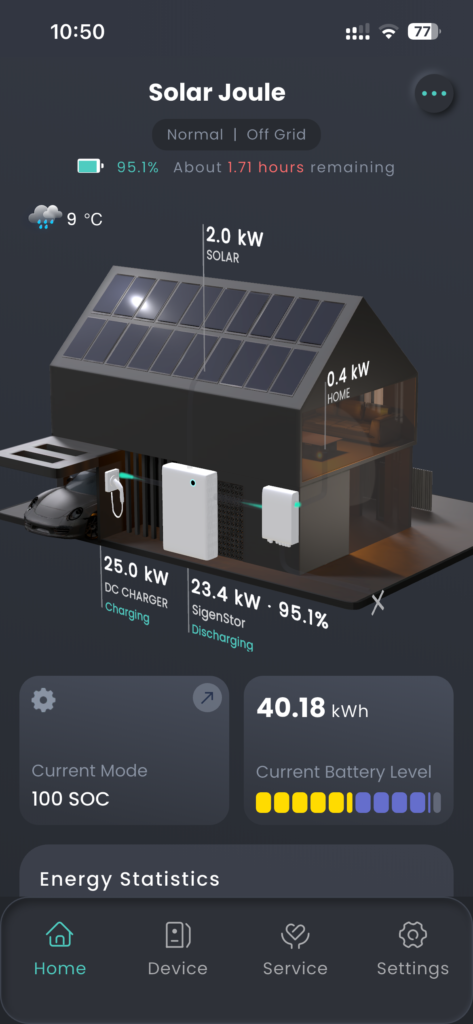
This means we could charge our 60kWh car from 45% to full in under 2 hours just from the Sigstor batteries! It’s unlikely we will do this very often, but it’s a nice option to have. It would then take a few days to fully recharge the batteries to be able to do it again with no solar and only using cheap night rate electricity from the grid. In summer with good solar it would be recharged in less than a day (our solar can generate 80kWh on a good day). We normally recharge the car every 2 to 3 days by about 25 kWh, which is very easy to achieve. It will just be nice on a morning where the car is at say 60% and we decide to go to Dublin for the day, we can recharge by the 40%/24kWh in an hour while we have breakfast.
We’re keeping the AC charger too, so still have that option if the house batteries are too low to provide a significant charge.
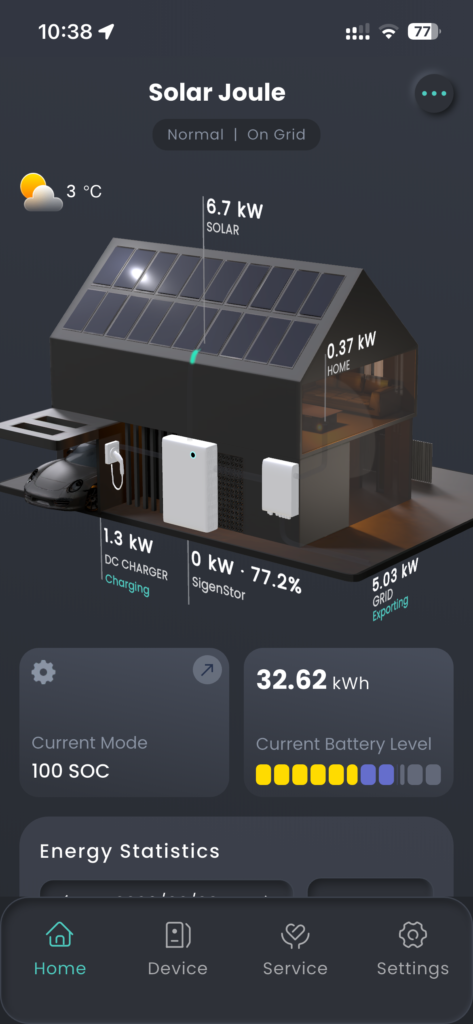
The DC EV charger is great if there is an unexpectedly sunny day and the house batteries are nearly full or are full, and the inverter is exporting at 5kW, rather than getting solar clipping, I can plug in the car and pull from the DC side to use the solar and even drain the house battery at the same time as exporting at maximum power, to avoid clipping.
I have also done what I call hybrid charging. I charge the car on the AC charger and the Sigstor batteries at the same time on the cheap EV rate. Then in the morning, switch the car to the DC EV charger to finish the charge from the Sigstor batteries. This effectively allows me to charge the car by 36kWh in one night only using electricity from my cheap rate, 3 hour, EV window.
Bi-directional Use
The DC EV charger is bi-directional so can also be used to discharge power from the car. This can be useful during a power cut or to increase revenue by exporting the power to grid. It should be noted that in cold weather, less than about 5°C, the discharge power may initially be lower than normal. After approximatly 15 minutes the discharge power will increase as the car batteries will have had a chance to warm up by then.
If you need a CCS2 EV plug holder and cable organiser I have a 3D printable design on Maker World you can download for free and print, see:
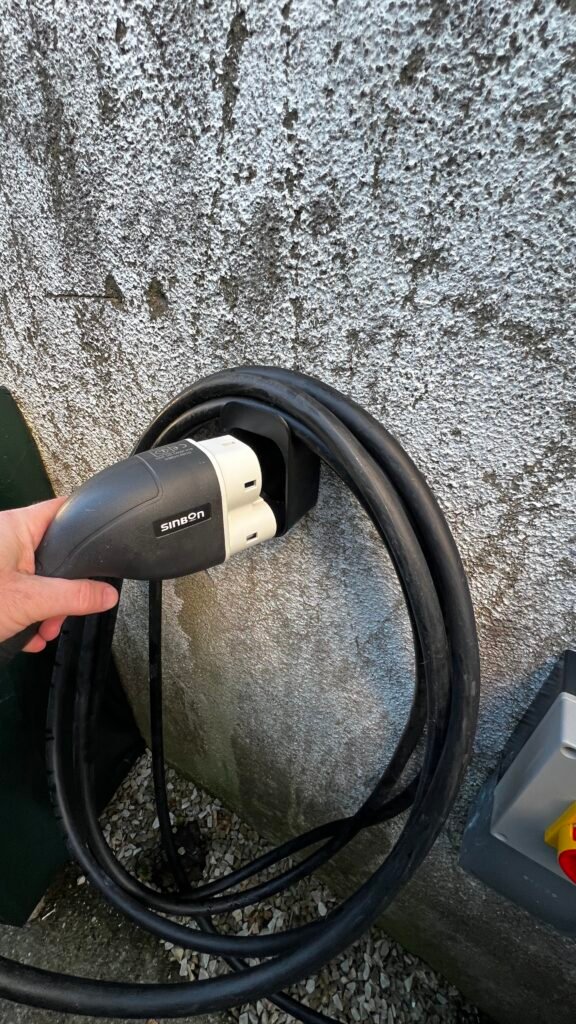
CCS2 EV Charger Plug and Cable Wall Bracket
9. Basic Electrical Understanding (Not many like maths, so keeping it simple!)
Key units
Potential difference
Unit: Volt (V)
Measures electrical “pressure” between points—like water height difference driving flow through a pipe.
Europe grid: nominal 230 V AC (±10% tolerance, ~207–253 V), 50 Hz (polarity reverses sinusoidally).
Batteries/solar: DC (constant polarity). Sigenergy batteries: ~9 cells × 3.2 V nominal → ~29–30 V. Solar panels: ~30–50 V open-circuit per panel; strings up to 600 V max (inverter limit ~550 V operating)
Flow of electricity
Unit: Ampere (Amp, A) or I
Rate of charge flow – like water volume per second through pipe
Rate of work / Power
Unit: Watt (W)
Power = Voltage (V) × Current (A)
Like pressure × flow rate determining work (e.g., turning a wheel).
Energy over time: Watt-hours (Wh)
Peak power is often used for solar panel specifications Watt-peak (Wp).
A science shorthand you will often come across is the use of a letter to show the magnitude of a unit. For example, 1,000,000 W could also be written as 1,000 kW or 1 MW.
Apparent Power, Real Power, and Power Factor
You may also come across kVA (kilovolt-amperes), which is thousands of volt-amperes (VA). Volt-amperes might seem like they should equal watts, since watts (W) = volts (V) × amps (A), and VA = V × A. However, in AC systems, voltage and current are not always perfectly in phase.
When voltage and current are perfectly in phase, real power (watts) equals apparent power (VA) – this is the ideal case for purely resistive loads (like heaters or incandescent bulbs), where PF = 1 (unity power factor).
In practice, this is rare. Many loads are inductive (e.g., motors, transformers, or coils), where inductance causes the current to lag behind the voltage. This lag means some energy is stored in the magnetic field and returned to the source each cycle, rather than doing useful work – it’s called reactive power (measured in VAR, volt-amperes reactive).
Conversely, capacitive loads (e.g. large capacitors) cause the current to lead the voltage, supplying reactive power.
This phase difference reduces efficiency: more apparent power (VA) must be supplied from the grid to deliver the same amount of real power (watts) that actually does work (e.g., turning a motor shaft or producing heat/light).
The power factor (PF) quantifies this inefficiency. It is the ratio of real power to apparent power: PF = Real Power (W) / Apparent Power (VA)(or equivalently, PF = cos(θ), where θ is the phase angle between voltage and current).
PF ranges from 0 (purely reactive, no useful work) to 1 (perfectly efficient, all power does work). Inductive loads typically have lagging PF (e.g., 0.7–0.9 for motors), while capacitive loads have leading PF.
Power Factor Correction with Capacitors
Large electric motors often include capacitors (or capacitor banks) connected in parallel. The capacitor provides a leading current that counters the lagging current from the motor’s inductance. In an ideal setup, the capacitive and inductive reactive powers cancel each other out, bringing voltage and current back into phase (PF closer to 1, or unity).
This improves system efficiency: the grid supplies less apparent power (lower VA) for the same real power output, reducing current draw, line losses, and utility penalties for poor PF (common in commercial/industrial settings).
In your Sigenergy system, the inverter and loads (e.g., any motors or EV chargers) aim for high efficiency, but household PF is usually decent unless you have heavy inductive loads. So, for most conversation about home installations that are not too technical kVA and kW can be considered sufficiently close to not have to worry about.
10. Creating a Time-of-Use Profile
In Ireland we do not have dynamic tariffs yet (as of early 2026) and so it can be quite easy to optimise the system around a basic time-based tariff. The following is an explanation of how to set up your own custom Operating Mode. I will base this around setting a profile for the following situation:
Tariff: cheap EV rate between 02:00 and 05:00 and high rate the remainder of the day
System: 5.5 kW inverter with 18 kWh of batteries
Aim: Charge the SigenStor batteries on cheap EV rate, to load shift, and run the house all day from the batteries and solar. Export excess solar generated and any remaining capacity in the batteries prior to recharging.
Weather: winter with relatively low solar yield so consideration of solar clipping not required.
Maths:
Battery charging, 3 hours charge of 18 kWh batteries at 5.5 kW = 16.5 kWh
Ideal battery level at start of charge window 18 kWh – 16.5 kWh = 1.5 kWh, which is 1.5 / 0.18 = 8% State of Charge (SOC). As there are some inefficiencies in the system, lets round that up to 10%. Assuming a nighttime power use between midnight and the start of the charge period of 0.8 kW or 1.6 kWh for the 2 hours = 1.6 / 0.18 = 9% SOC. Now we can add this 9% to the 10% start of charging window target, to give us 19% as the amount we want the system to discharge down to before charging starts. Once the system discharges to this value in reverts to self-consumption. If the batteries are not excessively charged this could be achieved at the start of the discharge window and hence why we calculated the 9% buffer, so you don’t completely drain the battery and start importing from the grid.
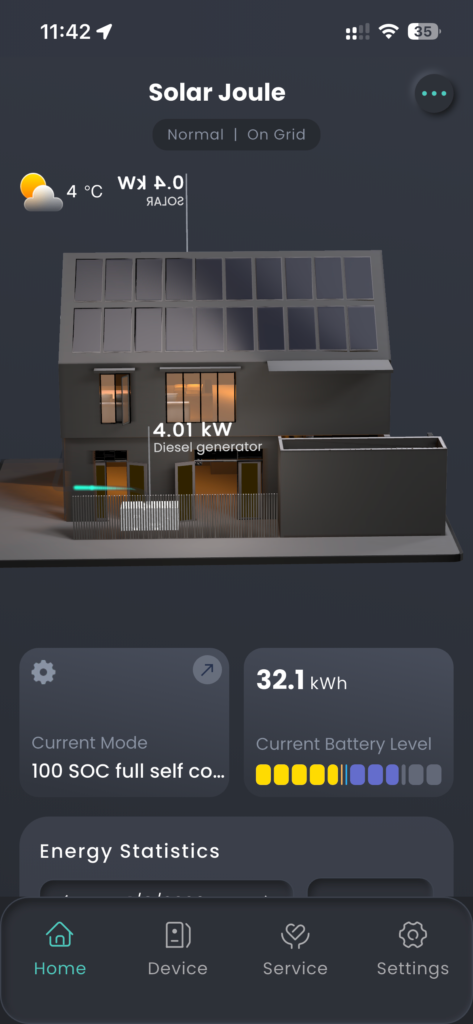
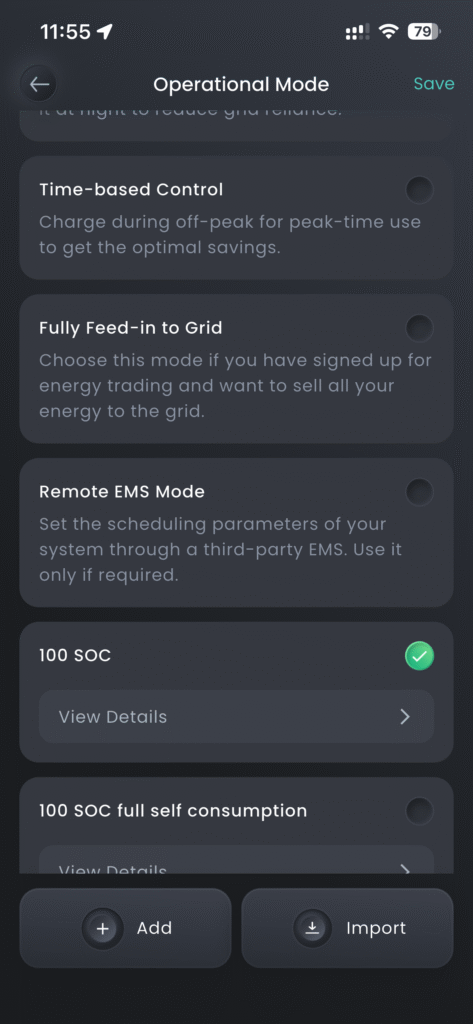
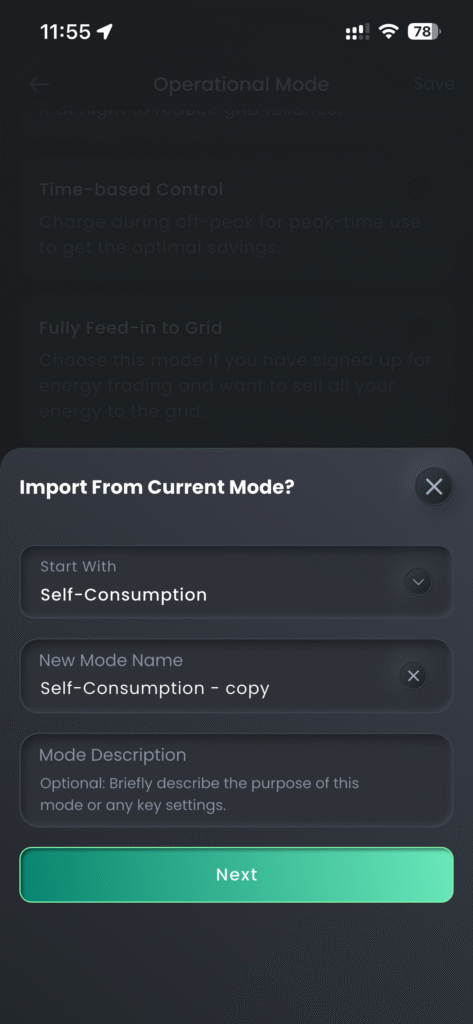
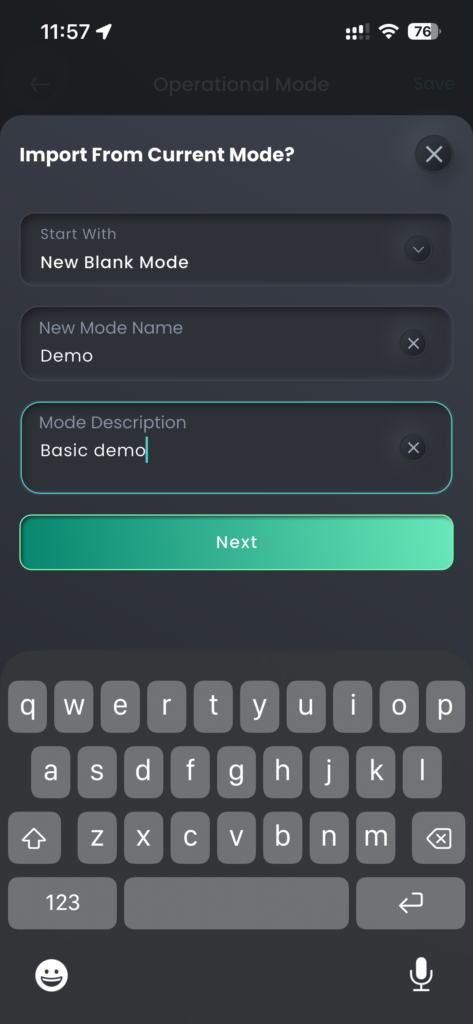
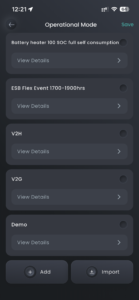
In the app on the home screen, tap on Current Mode, then on the next page Current Mode again. There is now a list of Operating Modes, the one that is in use will have a green round circle with a tick in it. To change modes simply tap into the blank hole of the mode you would like to use, it will turn green and save. To create a new Mode select + Add at the bottom of the page.
Change ‘Start With” to “New Blank Mode’ and then give it a name and description then Next.
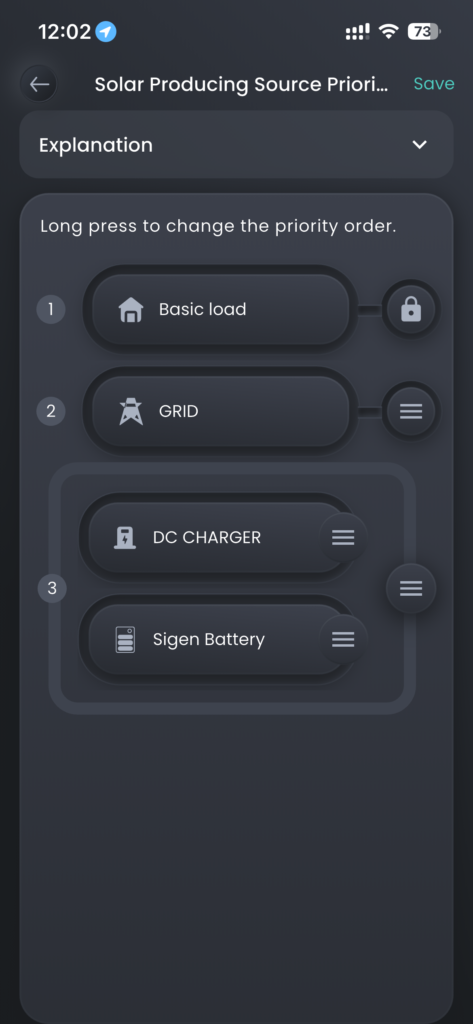
First setting to set is the Solar Producing Source Priority. Set it to 1. Basic load, 2. Grid, 3. Sigen Battery, then save. This will export excess solar to grid. Note: as I have a DC Charger it is shown with my Sigen Battery, you may not have this.
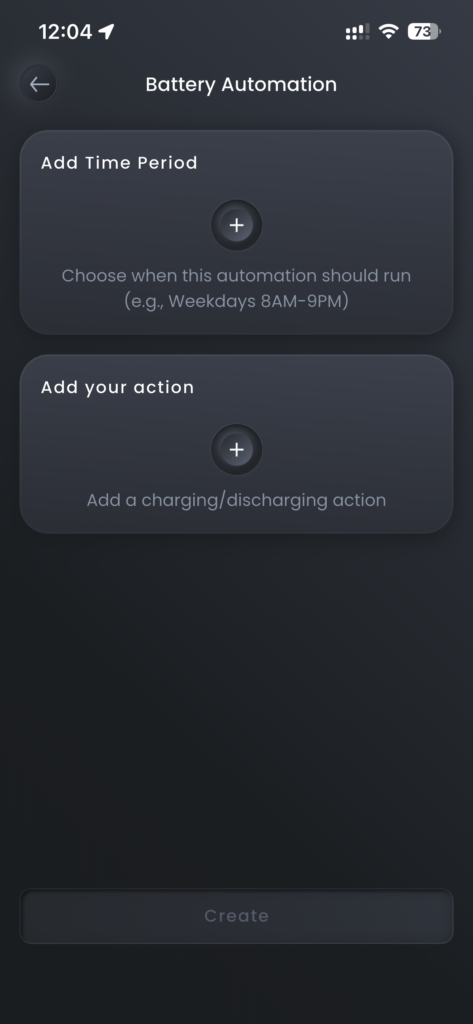
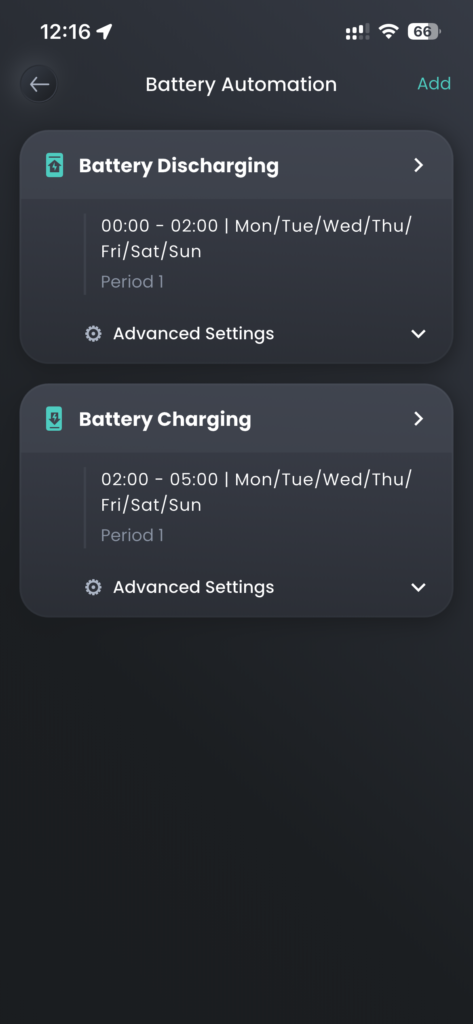
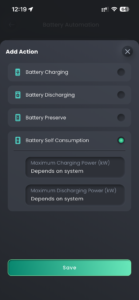
Next select Battery Automation, now we are going to build up the various time periods for the day. First, we are going to Add Time Period and set it to 00:00 to 02:00 and set the Select All box so it does it for every day of the week and then Create.

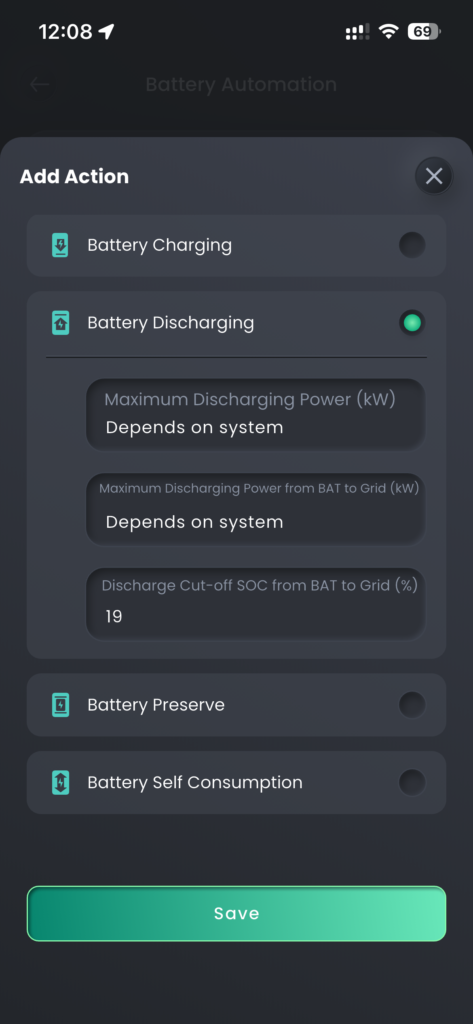
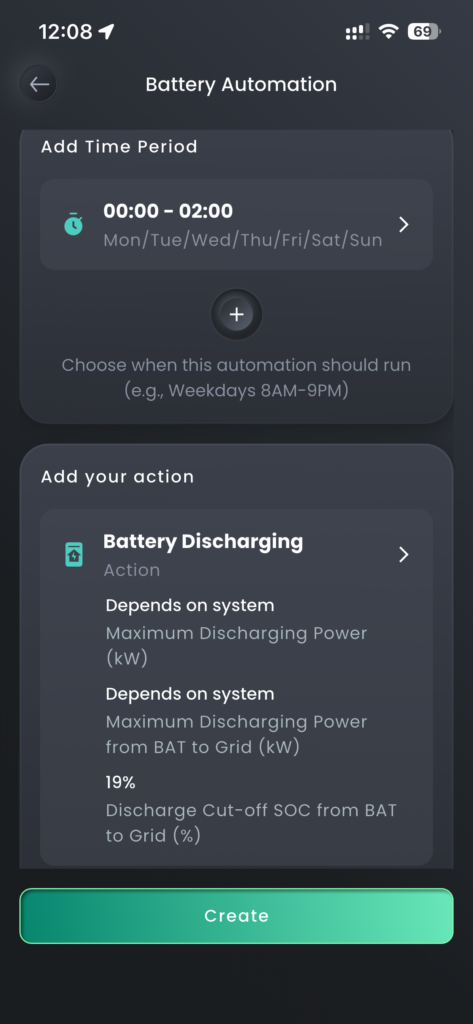
Now Add your action and select Battery Discharging, the discharging powers can both be left set to Depends on system, set the Discharge Cut-off SOC from BAT to Grid to 19% and save, then Create. That is the first time period set.
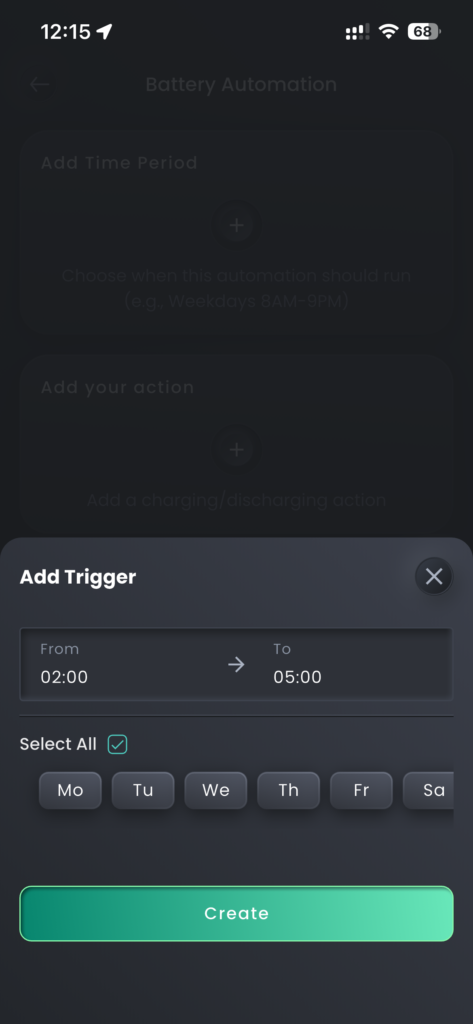
Now click Add to start to create the next time period. Add Time Period, you can see the from time is already set to the end of the last period. Set the to time to 05:00 and Select All and Create.
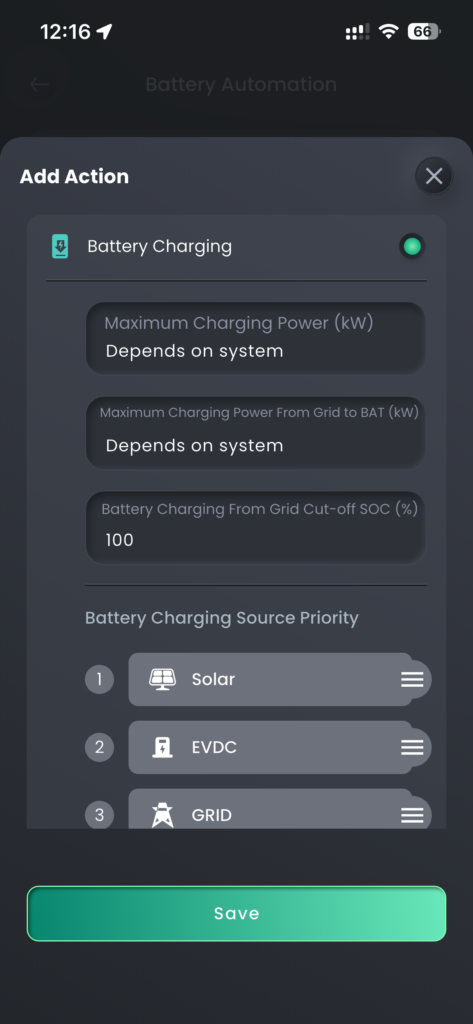
Add your action, Battery Charging, you can leave all the setting at default and save, then Create.
Now we will add the final time period, click Add, then Add Time Period. The times do not need changing, 05:00 to 24:00 but select Select All and Create.

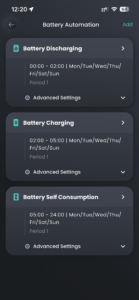
Now Add your action and select Battery Self Consumption and leave the default settings and Save, then Create. You can see the 3 time periods and what they are set too, now select the back arrow top left and then Save.
You can now scroll down through the Operational Modes to find the one you have just created at the bottom. Select it, green tick on the right, then save to make it active. Now use the top left back arrow and you can see it in My Energy Profile and back arrow again to return to the home screen. You can see that the Current Mode is now set to mode you just created.
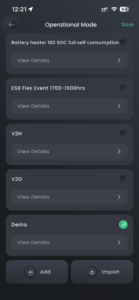
To save you some time the share code for the above Mode is 80AF1Q2xHq this code and be used in the Import on the Operational Mode page.